2.11.1
The institution has a sound financial base and demonstrated financial stability to support the mission of the institution and the scope of its programs and services.
The member institution provides the following financial statements: (1) an institutional audit (or Standard Review Report issued in accordance with Statements on Standards for Accounting and Review Services issued by the AICPA for those institutions audited as part of a system wide or statewide audit) and written institutional management letter for the most recent fiscal year prepared by an independent certified public accountant and/or an appropriate governmental auditing agency employing the appropriate audit (or Standard Review Report) guide; (2) a statement of financial position of unrestricted net assets, exclusive of plant assets and plant-related debt, which represents the change in unrestricted net assets attributable to operations for the most recent year; and, (3) an annual budget that is preceded by sound planning, is subject to sound fiscal procedures, and is approved by the governing board. Audit requirements for applicant institutions may be found in the Commission policy “Accreditation Procedures for Applicant Institutions.” (Financial resources)
Compliance Judgment
X In compliance Partially compliant Non-compliant
Narrative
The University’s rationale for compliance to this requirement can be seen through review of the three specific financials statements requested per the compliance requirement. As supplement to these specific reports, an overview of the University’s analysis of its financial stability, sound financial management practices, as well as its financial base and reserves will be summarized.
Financial Statement 1 – Institutional Audit
At the time of this report, the University’s most recent fiscal year audit was Fiscal Year 2015-2016. The audit in which we received a clean opinion is submitted as evidence of our compliance to generally accepted accounting principles [1].
Financial Statement 2 – Statement of Financial Position of Unrestricted Net Assets Excluding Plant
The unrestricted net assets for many state institutions of higher education significantly changed in FY 2014-2015 due to the implementation of GASB 68, Accounting and Financial Reporting for Pensions, which required the University to report as obligations the net pension liability (or unfunded liability) for its defined benefit plans which include the South Carolina Retirement System (SCRS) as well as the Police Officer Retirement System (PORS).
We have reported above UNAEP as reported in our financial statements and have reported adjusted UNAEP for comparative purposes. Using data found in annual Financial Statements and Schedules, the following table reveals that over a three-year period UNAEP has once again begun to trend upward. UNAEP only slightly decreased in Fiscal Year 2013-Fiscal Year 2015 in part due to the receipt of several deferred maintenance funding appropriations that required a 1:1 match of our receipt of said state funds as well as the decision to construct a new Office Services Building using University reserve funds. Between the construction of the Office Service Building, which totaled $669,981 and the deferred maintenance projects, which during this time period totaled roughly $480,462, $1,150,443 of the University’s UNAEP has been used to improve the University’s infrastructure. This was a planned decrease in UNAEP. The upswing in 2015-16 was primarily due to strong summer semester tuition and fee revenues that exceeded budget expectation, state operating appropriation increases of $779,000, as well as prudent operating expense management that allowed us to carry a general operating surplus fund reserve of $2.7m into Fiscal Year 2016-17. These UNAEP Statements are summarized in Table 1 below.
| UNAEP Statements | |||||
|---|---|---|---|---|---|
FY2011-12 | FY 2012-2013 | FY 2013-2014 | FY 2014-2015 | FY2015-16 |
|
| UNAEP | $7,044,892 | $7,044,892 | $4,465,002 | $(42,528,828) | $(41,418,352) |
| Adjusted UNAEP | $4,203,245 | $6,216,217 |
|||
Table 1. UNAEP Statements
The University has not experienced a UNAEP deficit over the five-year period. The University has had sufficient reserves and unobligated budgetary reserves to prevent deficits from occurring.
Financial Statement 3 – Annual Budget and Planning Process
The University’s Fiscal Year 2016-2017 Annual Budget and Board of Trustees Resolution approving the budget is shown in the Resolution for University Budget Approval [2]. Our planning process and fiscal procedures of the development of this budget is documented in the narrative below.
The University’s budget planning process evolves under the direction of the President of the University, Provost, Vice President for Business Affairs, and the Vice President for Administration working with the Office of Financial Services. The University budget development has three major budgets developed annually:
- The State Budget submitted to the Executive Budget Office used as the budgetary request for state appropriations from the Legislature of the State [3].
- The President’s Proposed Budget is drafted annually based on the previous fiscal year’s actual performances modified for increases and decreases in revenue and expenditures as well as programmatic changes anticipated annually. This budget is drafted over several budget meetings (February – May) by the President, Provost, Vice Presidents of Business Affairs and Administration and the Assistant Vice President for Financial Services [4].
Once the President’s Proposed Budget is drafted, detailed budget worksheets are submitted to the Vice Presidents for departmental allocations within their respective division [5]. The Vice Presidents return this information, and this is the basis for departmental allocation of budgetary resources for the fiscal year.
- Using the President’s Proposed Budget, the Board of Trustee’s Budget [6] is created which is the final budget that establishes authority for revenue receipting and expense budgeting for the fiscal year.
Shared governance is ensured by budget briefings with our Budget Committee that consists of our President, Provost, Vice President for Business Affairs, Vice President for Administration, Chair of Faculty, and two additional faculty members.
Planning can begin years in advance for major programmatic or infrastructure projects, but all budgetary processes typically follow the following 12-month calendar of events as seen in Table 2.
| 12-Month Budgetary Process | ||
|---|---|---|
| September | October | November |
| University Accountability Report Submitted | State Budget Plan submitted to Executive-Budget Office | |
| December | January | February |
| -Release of the Governor’s Executive Budget -Legislative session begins -House Ways and Means Committee Presentation | University budget meetings for adoption of new year budget commence | |
| March | April | May |
| Senate Finance Committee presentation | Preparation and distribution of departmental budget planning reports | |
| June | July | August |
| -State Legislature and Governor finalize the State’s Appropriation Act -FMU Board of Trustees votes on approval of the University Budget and fee increases (if deemed necessary) -Finalized /approved budgets are loaded into University accounting system | ||
Table 2. 12-Month Budgetary Process
Note: Italics indicates state budget process while regular text indicates the University’s internal budget process
A detailed flowchart of this process is also available [7].
Summary of the University’s Financial Stability, Sound Financial Management, and Financial Base and Reserves
The University demonstrates financial stability through its ability to garner significant funds from the various revenue sources typical to state institutions, which includes tuition and fees, auxiliary revenues, grants and contracts, appropriations and other miscellaneous sources as seen in Table 3 and Figure 1 below (all dollar amounts are in thousands unless otherwise indicated).
| University Funds 2012-2016 | |||||
|---|---|---|---|---|---|
2012 | 2013 | 2014 | 2015 | 2016 |
|
| Tuition and Fees | $21,142 | $20,347 | $20,550 | $20,127 | $20,851 |
| (Gross) Auxiliary | $1,037 | $1,169 | $1,157 | $953 | $1,817 |
| Grants and Contracts | $11,110 | $10,947 | $11,113 | $12,008 | $11,812 |
| Appropriations | $11,634 | $13,905 | $12,721 | $17,241 | $16,158 |
| Gifts and Grants | $4,659 | $2,020 | $9,340 | $3,305 | $5,992 |
| Other | $8,821 | $9,233 | $12,627 | $9,533 | $10,472 |
| Total | $58,403 | $57,621 | $67,508 | $63,167 | $67,102 |
| % Change | 2.3% | -1.3% | 17.2% | -6.4% | 6.2% |
Table 3. University Funds 2012-2016*
*Source: Data come from the FMU 2016-2017 Financial Indicator Matrix provided to the SC Commission on Higher Education.
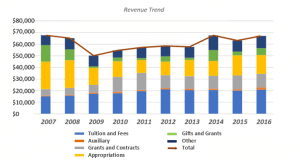
Figure 1. Revenue Trend 2007-2016*
*Source: Data come from the FMU 2016-2017 Financial Indicator Matrix provided to the SC Commission on Higher Education.
Overall revenue has decreased 1% since 2007 but has been trending favorably since 2009 with an average increase of 3.4% over the past eight years and a total increase of 34% over the same period. As expected, tuition revenue is the primary revenue source, averaging 31% of total revenues over the past ten years.
Francis Marion University has also ensured financial stability through steady enrollment. Being a small state institution, the University understands it is critical that academic program creation correspond to state and local job demands. Ensuring programs meet both the demands of the area and the desires of the students are key to maintaining steady enrollment. Data concerning enrollment is provided in Figures 2 and 3 below.
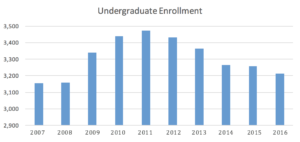
Figure 2. Undergraduate Enrollment*
*Source: Data come from the Office of Institutional Research at FMU.
![]()
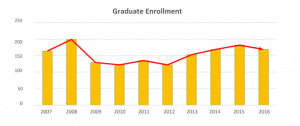
Figure 3. Graduate Enrollment*
*Source: Data come from the Office of Institutional Research at FMU.
Undergraduate enrollment growth has been steady with overall growth of 1.8% over the ten-year period. Graduate enrollment has also remained steady with growth of 3% over the ten-year period.
Our financial stability is also maintained through our financial base and behavior. Over the years, the University has sought to increase its maintenance and capital reserves in a conscious effort to ensure adequate funds are available for operating shortfalls should they occur as well as to ensure facilities can be adequately maintained. Many of the facilities on campus have begun approach the end of their depreciable life and that means that there is a growing demand for maintenance repair funding. The Administration of the University are cognizant of this need and seek to not only ensure University reserves are sufficient but also requests support via appropriations for maintenance of these facilities. Detail is provided in Figure 4 below.
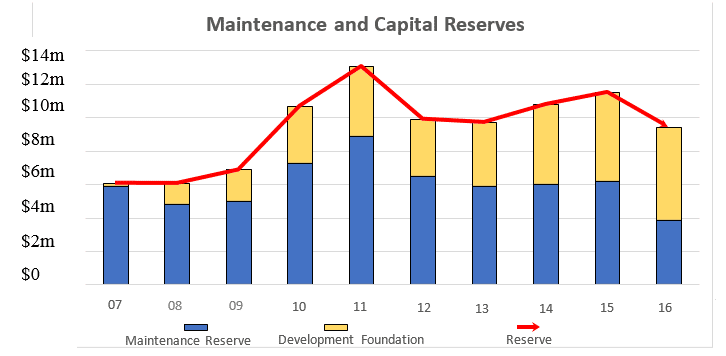
Figure 4. Maintenance and Capital Reserves*
*Source: Data come from the FMU 2016-2017 Financial Indicator Matrix provided to the SC Commission on Higher Education.
The maintenance reserve held by Francis Marion University has decreased over the ten-year period, with an average decrease of 3.5% per year but appears to be consistent with the increased operations and maintenance expenditures (at a rate of 4.8% per year). The development fund reserve held by Francis Marion University has increased significantly in 2008, with an average increase of 38% per year over the past nine years. There was a maintenance reserve decline in 2016. Maintenance reserves temporarily covered $1.9 million in construction costs until gifted funds were received in the fall of 2016. These funds have since then been returned to the capital reserve. Fiscal year ending 2017’s balance will be available upon completion of the audit in Fall 2017.
Overall, the University’s financial behavior has been typically debt averse relying heavily upon appropriations and tuition and fee revenue for both annual operations and capital projects. Capital construction has historically been through a wide range of revenue resources but typically was derived from capital gifts, State capital appropriations, internal capital reserve funds, and, only when deemed necessary by the University’s Board, debt financing. Data concerning the University’s debt capacity is provided in Figure 5 below.
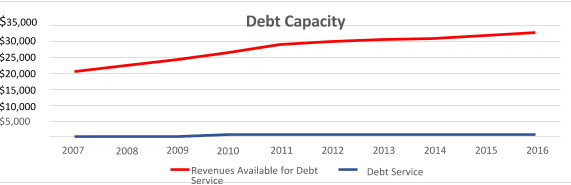
Figure 5. Debt Capacity*
*Source: Data come from the FMU 2016-2017 Financial Indicator Matrix provided to the SC Commission on Higher Education.
Board Oversight
The University is vigilant about ensuring it lives within its financial means. The Board of Trustees, management, as well as departmental directors monthly review financial reports to ensure budgets are adhered to. As support of the Board’s fiscal oversight, the Finance and Facilities Committee has monthly received a budget to actual report of the University’s operating account [8]. On a quarterly basis, the full Board of Trustees receives a quarterly financial report of all university funds [9]. Management as well as departmental directors have the ability to automatically receive monthly printouts from our accounting system in the administration of their duties. The University also allows live reporting of budgetary reports through its Campus Application and Data Service portal [10]. Special ad hoc reports are also periodically prepared by the Office of Financial Services when requested by the President and Senior Administration and at the request of departments.
Over the last ten years, the University through careful oversight and reporting as noted above has been able to hold expenses within budget for annual operations and consequently remain stable as seen in Figure 6 below. Additionally, Francis Marion University ensures this stability by following the State Budget Process [11].
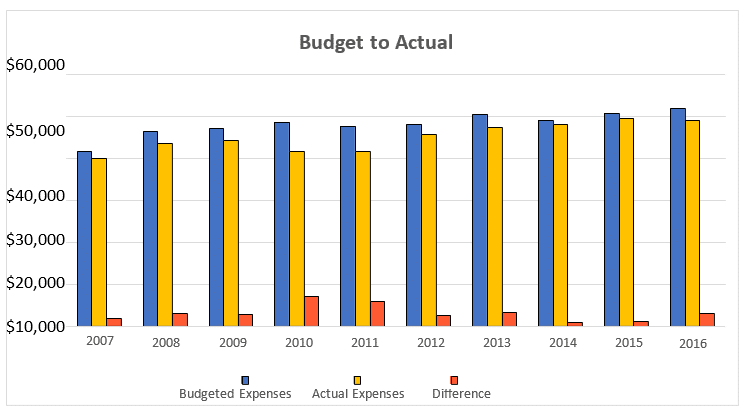
Figure 6. Budget to Actual*
*Source: Data come from the FMU 2016-2017 Financial Indicator Matrix provided to the SC Commission on Higher Education.
The University has consistently had actual expenses not exceed budgeted expenses in each of the past ten years by an average of $3.1 million per year.
In summary, the University has a solid history of financial strength, prudent fiscal behavior, oversight, and adequate financial reserves that support the University and its academic and mission critical endeavors.
Documentation
- Audited Financial Statements 2015-2016
- Resolution for University Budget Approval 2016-2017
- Agency Budget Plan 2016-2017
- Budget Meeting Handout 2016-17, Proposed Budget
- Detail Budget Worksheets 2016-2017
- Resolution for University Budget Approval 2016-17
- Detailed Budgetary Process Flowchart
- Board of Trustees Monthly Report, May 2017
- Board of Trustees Quarterly Report, March 2017
- FMU Website, CADS
- State Budget Process